
Reading an HPLC Chromatogram: A Researcher's Guide to Purity Peaks
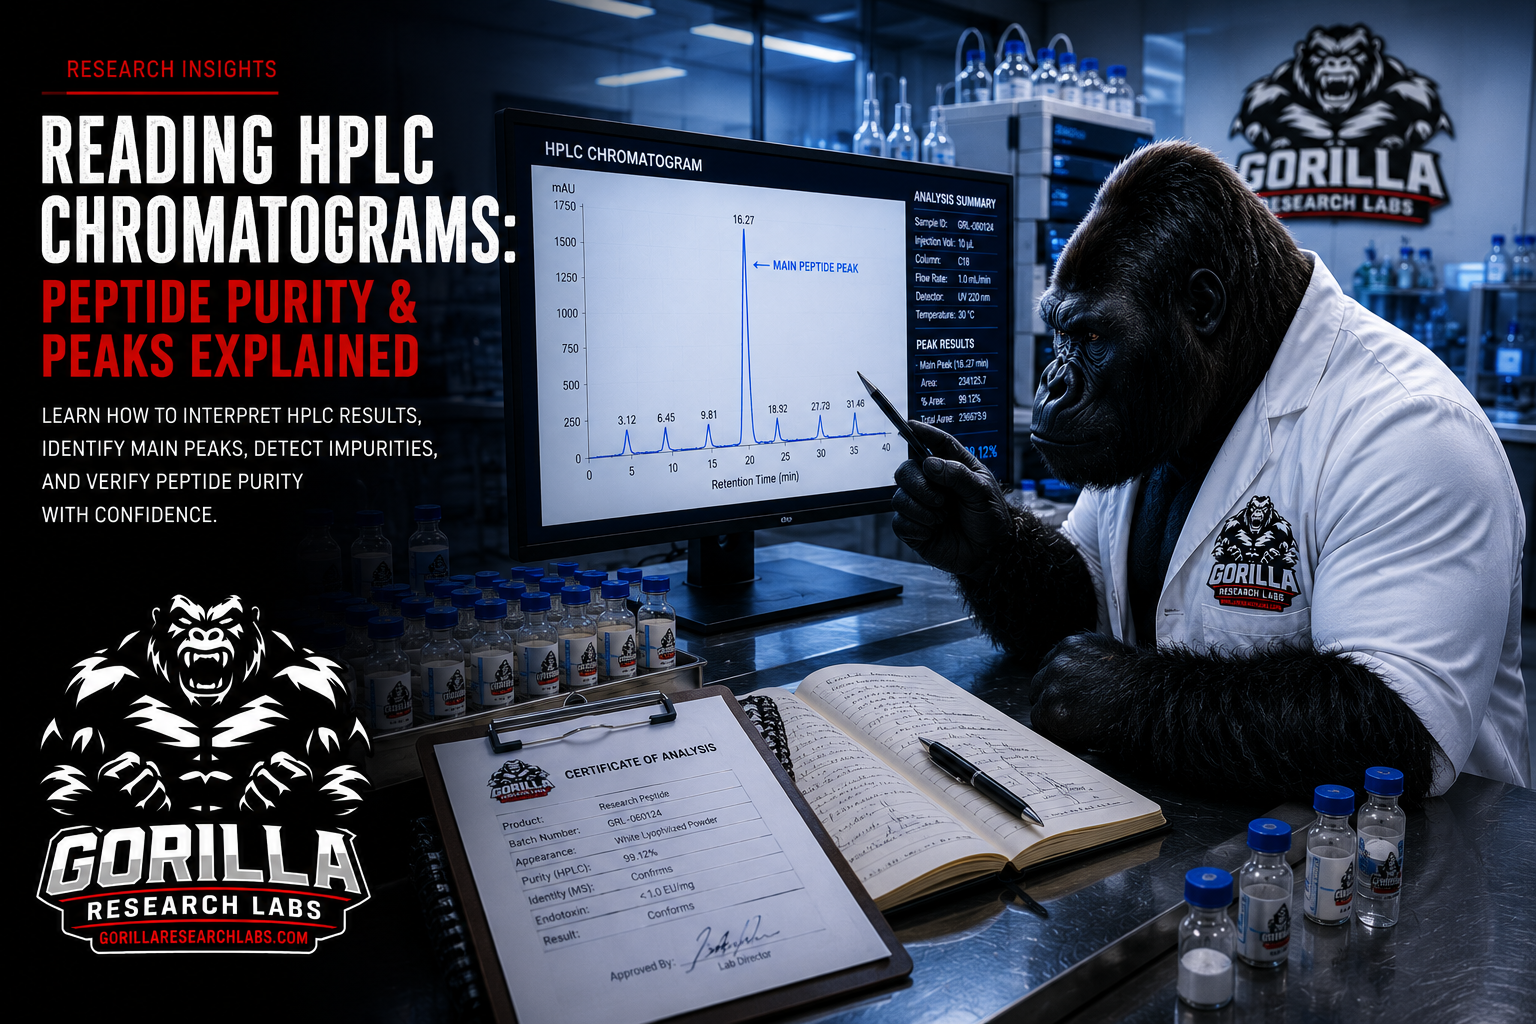
Beyond the number on the COA
A COA may report a figure such as “98.2% area by HPLC,” but that value is interpretable only with the chromatogram, method, integration rules, detector, wavelength, sample preparation, and peak assignment. This guide explains what a trace can show—and what it cannot establish about total sample composition.
What a chromatogram actually plots
An HPLC chromatogram plots detector response against time. The detector may be UV or another configured detector, and only responsive species within the method's range appear. Components may separate into peaks, co-elute, remain unresolved, or go undetected; a visually simple trace is not proof of a chemically simple sample.
The four features to read first
• The assigned main peak — the peak the method assigns to the target using a reference or other evidence. The largest peak is not automatically the target. • Retention time — the point on the time axis where a peak reaches its apex. Under a controlled method it can support, but not uniquely prove, a peak assignment. • The baseline — the flat reference line the trace returns to between peaks. A steady, low, level baseline indicates a stable method and a clean background. Drift, noise, or a wandering baseline can obscure small peaks and complicate interpretation. • Other detected peaks — smaller peaks may be related substances, process residues, degradation products, solvent artifacts, system peaks, or unknowns. Assignment requires evidence.
How percent purity is calculated
Many peptide COAs report an area-percent result. Software integrates selected peaks, but integration boundaries, excluded peaks, wavelength, and different detector response factors affect the number. Equal area does not necessarily mean equal mass or molar amount for different compounds. The calculation is a ratio: the area of the main peak divided by the total area of all integrated peaks, expressed as a percentage. • Main peak area ÷ total peak area × 100 = area-percent purity • If the main peak accounts for 982,000 of 1,000,000 total area units, the trace reports 98.2% • The remaining 1.8% is the combined included detector response, not necessarily the total impurity mass or a complete impurity profile This is why two samples can share the same headline purity yet look different on paper. A trace with one small 1.8% impurity is not identical to one with a dozen tiny peaks summing to 1.8%, even though the COA number matches.
Why a single sharp peak signals a cleaner sample
A narrow, symmetrical peak and controlled baseline can indicate acceptable chromatographic performance, but system-suitability criteria—not appearance alone—determine whether resolution and quantitation are adequate. Broadening, tailing, shoulders, drift, and noise are investigation signals, not automatic impurity identifications. Review peak assignment, resolution, system suitability, blank and standard runs, integration, detector response, and the full method. No visual pattern by itself proves that a sample is “clean.”
Reading the trace, not just the number
Method literacy means reading the percentage, trace, method, system-suitability results, integration report, standards, and limitations together. The chromatogram provides useful evidence, but it cannot establish undetected content, absolute peptide mass, sterility, endotoxin status, or full identity on its own. For laboratory research use only. Not for human or animal consumption. Not a drug, supplement, or medical product. No statements have been evaluated by the FDA, and nothing here is intended to diagnose, treat, cure, or prevent any disease. This article is educational content about analytical methods only.
References
- National Center for Biotechnology Information — Peptides (StatPearls)
- PubMed — Therapeutic peptides: current applications and future directions
- PMC — High-performance liquid chromatography (HPLC) principles and practice
- U.S. FDA — Analytical Procedures and Methods Validation for Drugs and Biologics
- U.S. FDA — Q6A Specifications: Test Procedures and Acceptance Criteria
Authoritative sources cited for research context. Research use only — not medical advice.